Life Extension Magazine®

Heart Failure has grown to an epidemic involving multi-year suffering, hospital confinement and high medical expenditures.
The map on this page reveals sharply varying heart failure death rates, depending on the region of the United States.
The dark red areas with the highest death rates represent population groups who often engage in dangerous lifestyles and do little to prevent age-related disorders.
This map is corroborated by a study published in The Lancet Public Health showing marked differences in the “age-related disease burden” among countries.1
In a startling revelation, a 76-year-old in Japan and 46-year-old in Papua, New Guinea have the same level of age-related health problems as an average 65-year-old worldwide.1
The United States ranked 54th on this list, between Algeria and Iran.1,2
The age-related disease differences among countries, along with maps showing wide discrepancies across different regions in the United States, help validate the degree of control we exert over our personal health.
I’ve copied maps of the United States in this article showing wide variations in disease incidence, much of them having to do with controllable risk factors.
Much more can be done to forestall the disease burden of maturing Americans.
For 40 consecutive years, our Life Extension® group has advocated for nationwide enactment of proven age-delaying strategies.
Some people misunderstand the mission of Life Extension®.
They think we only seek to extend the lives of elderly people, regardless of how many degenerative disorders they suffer.
To the contrary, we advocate aggressive, preventive strategies to reduce disease risks.
Epidemiological data reveal most long-lived groups enjoy reduced age-related disease burdens.4,5 Such “healthy aging” usually translates into longer lifespans.
An exception is the United States. We rank number 34 in life expectancy,6 but come in at 54 as it relates to our burden of age-related disease.1,2
This means that while Americans live longer than in many other countries, we suffer more degenerative afflictions that diminish quality-of-life.
Readers of Life Extension® magazine follow healthier lifestyle patterns to reduce their age-related disease burden.
Death from Heart Failure Varies by Geography
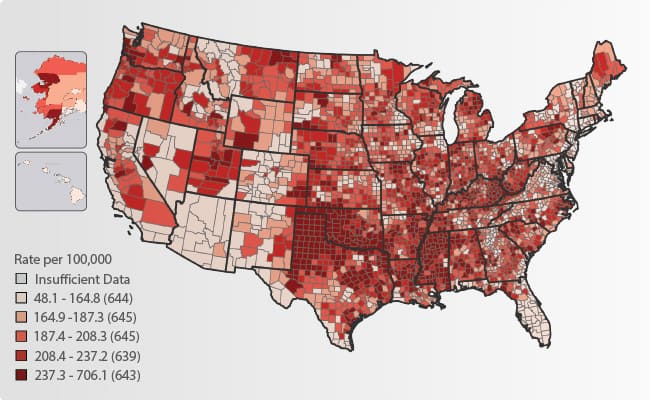
The map above shows the rate of death from heart failure by county during 2014-2016.
Reference to specific commercial products, manufacturers, companies, or trademarks does not constitute its endorsement or recommendation by the U.S. Government, Department of Health and Human Services, or Centers for Disease Control and Prevention.
This material is otherwise available on the agency website for no charge.
You Control Disease Risk and How Old You Feel!

New Guinea: 46-year-old = 65-year-old
Japan: 76-year-old = 65-year-old
A 76-year-old in Japan and 46-year-old in Papua, New Guinea have the same age-related disease burdens.
30-Year Difference in Age-Related Disease Burdens
Measuring population ageing: an analysis of the Global Burden of Disease Study 2017. Lancet Public Health. 2019 Mar;4(3):e159-e67.
More Money Does Not Always Translate to Better Health
Americans spend more healthcare dollars per capita than people in any other country.
Yet overall health rankings often show the United States coming in last among developed countries.
Some blame conventional medicine for delivering longer lifespans but failing to extinguish our burden of chronic-disorders.
The map on this page, however, depicts sharp contrasts in life expectancy in different regions of the United States.
A lot of this is attributable to socio-economic differences. People live longer in safer neighborhoods with higher-quality health care, a cleaner environment, and better lifestyle choices.
While major problems exist with how medicine is priced and practiced in the United States, much of the higher age-related disease burden (and reduced longevity) is self-inflicted, such as eating an unhealthy diet.
A Mayo Clinic study shows that less than 3% of Americans meet even the basic criteria for a “healthy lifestyle.”9
I’d like to think most of you fit into this “healthy lifestyle” category, but we are all challenged to do everything right.
Life Expectancy at Birth by County Map7
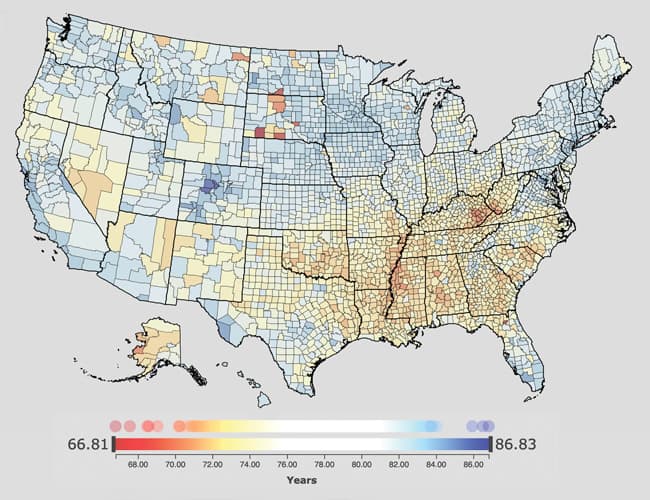
This map shows the life expectancy at birth by county in the United States.
Note the longevity disparities where people die much sooner compared to counties where people live longer.
People in blue areas are living longer than those in orange and reddish regions.
Female Life Expectancy at Age 50 by County
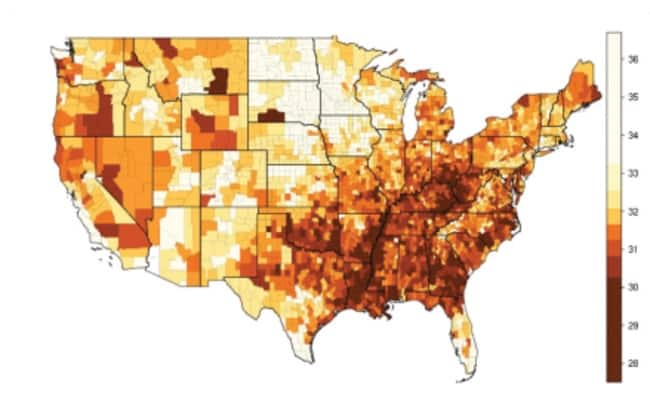
Male Life Expectancy at Age 50 by County
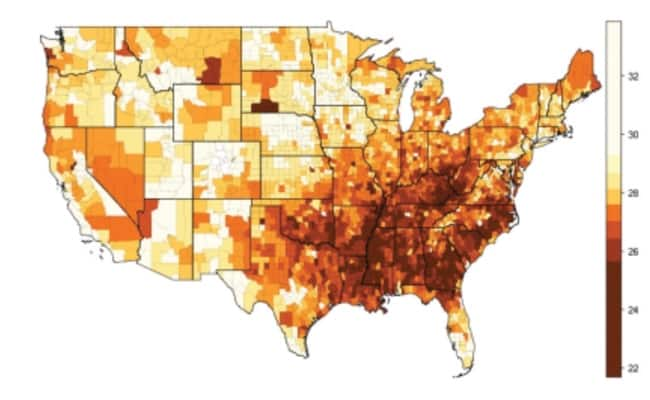
Longevity Disparity Of Older Americans at Age 50 in United States8
These maps show the average number of years a 50-year-old can expect to live.
Note the longevity disparities in regions where people die much sooner compared to those where people are living longer.
The maximal life expectancy differences of about 10 years reflect averages, and do not take in account the aggressive preventative strategies utilized by most readers of Life Extension® Magazine.
Factors Influencing Longevity
Huge discrepancies of disease burden and life expectancy exist among countries around the world.
A lot has to do with high infant and maternal mortality, infectious disease prevalence, poor sanitation, and lack of access to clean water in less developed countries.
And while these factors appear obvious today, they were met with fierce skepticism in the past.
For instance, it required meticulous research by Dr. John Snow in the mid-1800s to demonstrate that ingesting feces-laden water was the culprit behind cholera and other water-borne infections.14
Physicians in 1854 attributed cholera to other factors that characterized London at that time. Dr. Snow spent years proving them wrong.
Rational decision making has not improved much on a relative basis since Dr. Snow’s time. This can be seen in geographic regions where scant attention is paid to healthy living, including high prevalences of obesity and tobacco use.
The penalty for unhealthy choices is a higher burden of age-related diseases and shorter lifespans.
The longevity benefits associated with one’s healthy lifestyle are well documented. Yet most Americans are failing to take meaningful steps to slash their age-related disease burden.

Life Expectancy Inequalities Among U.S. Counties (1980-2014)
A study published in JAMA Internal Medicine concluded:
“Geographic disparities in life expectancy among U.S. counties are large and increasing.
Much of the variation in life expectancy among counties can be explained by a combination of socioeconomic and race/ethnicity factors, behavioral and metabolic risk factors, and health care factors.
Policy action targeting socioeconomic factors and behavioral and metabolic risk factors may help reverse the trend of increasing disparities in life expectancy in the United States.”10
This report published by the American Medical Association is consistent with other data showing remarkable differences in longevity based on factors we largely can control.11-13
In This Month’s Issue
Despite impressive research findings published over the past 25 years, most Americans have insufficient or deficient vitamin D levels. A review article on page 64 describes new studies revealing the whole-health benefits of this low-cost supplement.
The data on the benefits of curcumin keep growing stronger while the cost of highly absorbable turmeric extract has dropped.
The article on page 32 of this issue describes findings indicating curcumin is even more beneficial than previously thought.
As people age, levels of cellular NAD+ markedly decline. Published findings are uncovering additional mechanisms showing that boosting NAD+ can help thwart multiple age-related disorders.
Dry eye afflicts 34% of people worldwide. A low-cost berry extract led to a 72% improvement in dry-eye-symptom scores. See the article on page 42 for details.
SAMe was introduced to the United States by Life Extension® in 1997. It became popular among those suffering severe mood disorders. New findings reveal SAMe has anti-aging properties by improving DNA methylation. The article on page 50 describes these data.
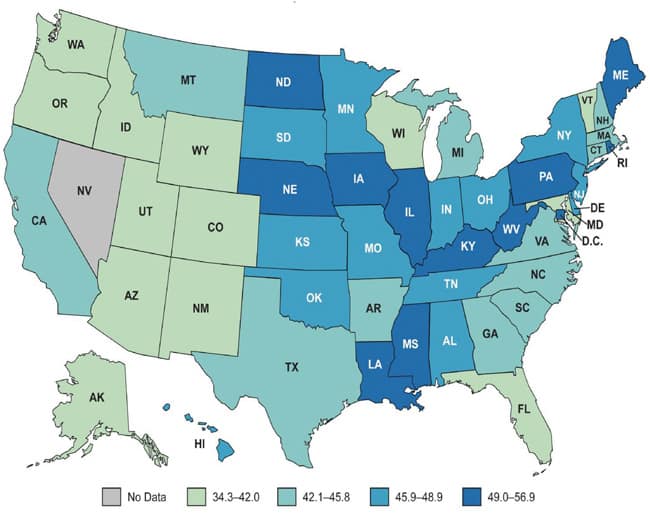
Colorectal Cancer Incidence Rates* by State, 2007†
Impact Statement
In this map, colorectal cancer incidence rates by state are displayed for diagnosis year 2007. The states are divided into groups based on the rates at which people developed colorectal cancer in 2007. The rates are the numbers out of 100,000 people who developed colorectal cancer each year.15
*Rates are per 100,000 and are age-adjusted to the 2000 U.S. standard population.
†Source: U.S. Cancer Statistics Working Group. United States Cancer Statistics: 1999–2007 (GA): Department of Health and Human Services, Centers for Disease Control and Prevention, and National Cancer Institute; 2010.
Available at: http://www.cdc.gov/uscs.
Reference to specific commercial products, manufacturers, companies, or trademarks does not constitute its endorsement or recommendation by the U.S. Government, Department of Health and Human Services, or Centers for Disease Control and Prevention.
This material is otherwise available on the agency website for no charge.
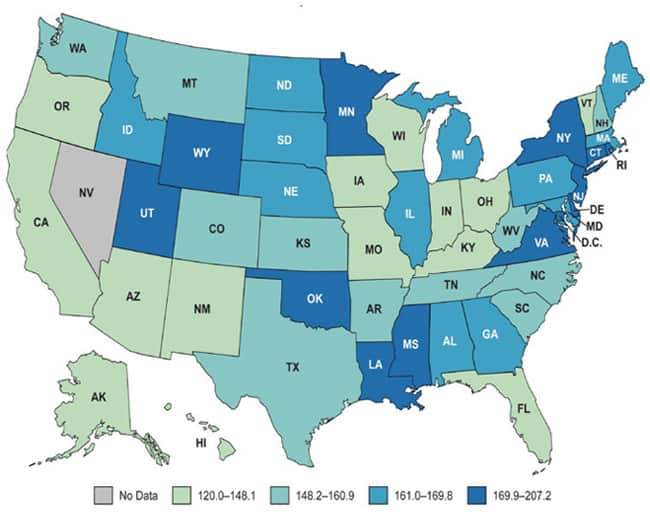
Prostate Cancer Incidence Rates* by State, 2007†
Impact Statement
In this U.S. map, prostate cancer incidence rates by state are displayed for diagnosis year 2007. The states are divided into groups based on the rates at which men developed prostate cancer in 2007. The rates are the numbers out of 100,000 men who developed prostate cancer each year.16
*Rates are per 100,000 and are age-adjusted to the 2000 U.S. standard population.
†Source: U.S. Cancer Statistics Working Group. United States Cancer Statistics: 1999–2007 Incidence and Mortality Web-based Report. Atlanta (GA): Department of Health and Human Services, Centers for Disease Control and Prevention, and National Cancer Institute; 2010.
Available at: http://www.cdc.gov/uscs.
Reference to specific commercial products, manufacturers, companies, or trademarks does not constitute its endorsement or recommendation by the U.S. Government, Department of Health and Human Services, or Centers for Disease Control and Prevention.
This material is otherwise available on the agency website for no charge.
Super Sale Prices
Just once a year, we discount prices on all the nutrients used by our supporters.
These discounts apply to updated versions of popular formulas that are designed to delay many underlying factors involved in biological aging.
Long-term supporters use the month of January to stock up on nutrients they use throughout the year.
The Super Sale pricing, volume discounts, and rebates on future purchases add up to significant savings.
To order your supplement staples at low Super Sale prices, please call 1-800-544-4440 (24 hours) by February 3, 2020.
For longer life,
William Faloon, Co-Founder
Life Extension Buyers Club
References
- Chang AY, Skirbekk VF, Tyrovolas S, et al. Measuring population ageing: an analysis of the Global Burden of Disease Study 2017. Lancet Public Health. 2019 Mar;4(3):e159-e67.
- Available at: https://medicalxpress.com/news/2019-03-age.html. Accessed November 12, 2019.
- Available at: https://www.cdc.gov/dhdsp/data_statistics/fact_sheets/fs_heart_failure.htm. Accessed November 8, 2019.
- Andersen SL, Sebastiani P, Dworkis DA, et al. Health span approximates life span among many supercentenarians: compression of morbidity at the approximate limit of life span. J Gerontol A Biol Sci Med Sci. 2012 Apr;67(4):395-405.
- Newman AB, Murabito JM. The epidemiology of longevity and exceptional survival. Epidemiologic reviews. 2013;35(1):181-97.
- Available at: http://apps.who.int/gho/data/node.main.SDG2016LEX. Accessed November 7, 2019.
- Available at: https://vizhub.healthdata.org/subnational/usa. Accessed November 8, 2019.
- Available at: https://www.ncbi.nlm.nih.gov/books/NBK62591/. Accessed November 8, 2019.
- Loprinzi PD, Branscum A, Hanks J, et al. Healthy Lifestyle Characteristics and Their Joint Association With Cardiovascular Disease Biomarkers in US Adults. Mayo Clin Proc. 2016 Apr;91(4):432-42.
- Dwyer-Lindgren L, Bertozzi-Villa A, Stubbs RW, et al. Inequalities in Life Expectancy Among US Counties, 1980 to 2014: Temporal Trends and Key Drivers. JAMA internal medicine. 2017;177(7):1003-11.
- Passarino G, De Rango F, Montesanto A. Human longevity: Genetics or Lifestyle? It takes two to tango. Immunity & ageing: I & A. 2016;13:12-.
- Willcox DC, Willcox BJ, Todoriki H, et al. The Okinawan diet: health implications of a low-calorie, nutrient-dense, antioxidant-rich dietary pattern low in glycemic load. J Am Coll Nutr. 2009 Aug;28 Suppl:5z00s-16s.
- Pes GM, Tolu F, Dore MP, et al. Male longevity in Sardinia, a review of historical sources supporting a causal link with dietary factors. Eur J Clin Nutr. 2015 Apr;69(4):411-8.
- Markel H. A piece of my mind. Happy birthday, Dr Snow. JAMA. 2013 Mar 13;309(10):995-6.
- Colorectal Cancer Incidence Rates, by State, 2007 U.S. Cancer Statistics Working Group. United States Cancer Statistics: 1999-2007 Incidence and Mortality Web-based Report. Atlanta (GA): Department of Health and Human Services, Centers for Disease Control and Prevention, and National Cancer Institute; 2010. Available at: http://www.cdc.gov/uscs, November 8, 2019.
- Prostate Cancer Incidence Rates by State, 2007 U.S. Cancer Statistics Working Group. United States Cancer Statistics: 1999–2007 Incidence and Mortality Web-based Report. Atlanta (GA): Department of Health and Human Services, Centers for Disease Control and Prevention, and National Cancer Institute; 2010. Available at: http://www.cdc.gov/uscs, November 8, 2019.

